Statistical modeling
As scientists, we often have in mind a generative process by which the data we measure are produced. For example, we might expect the optical density of a solution of E. coli in LB media to grow exponentially over time, with some small measurement error. To model this, we specify a model for how bacteria grow and a probability distribution to describe the variation in the measurements. We can then use the data and statistical inference to learn something about the parameters in the model.
You may have noticed the terms “cartoon model,” “mathematical model,” and “statistical model” in the cycle of science we introduced in the first lecture.
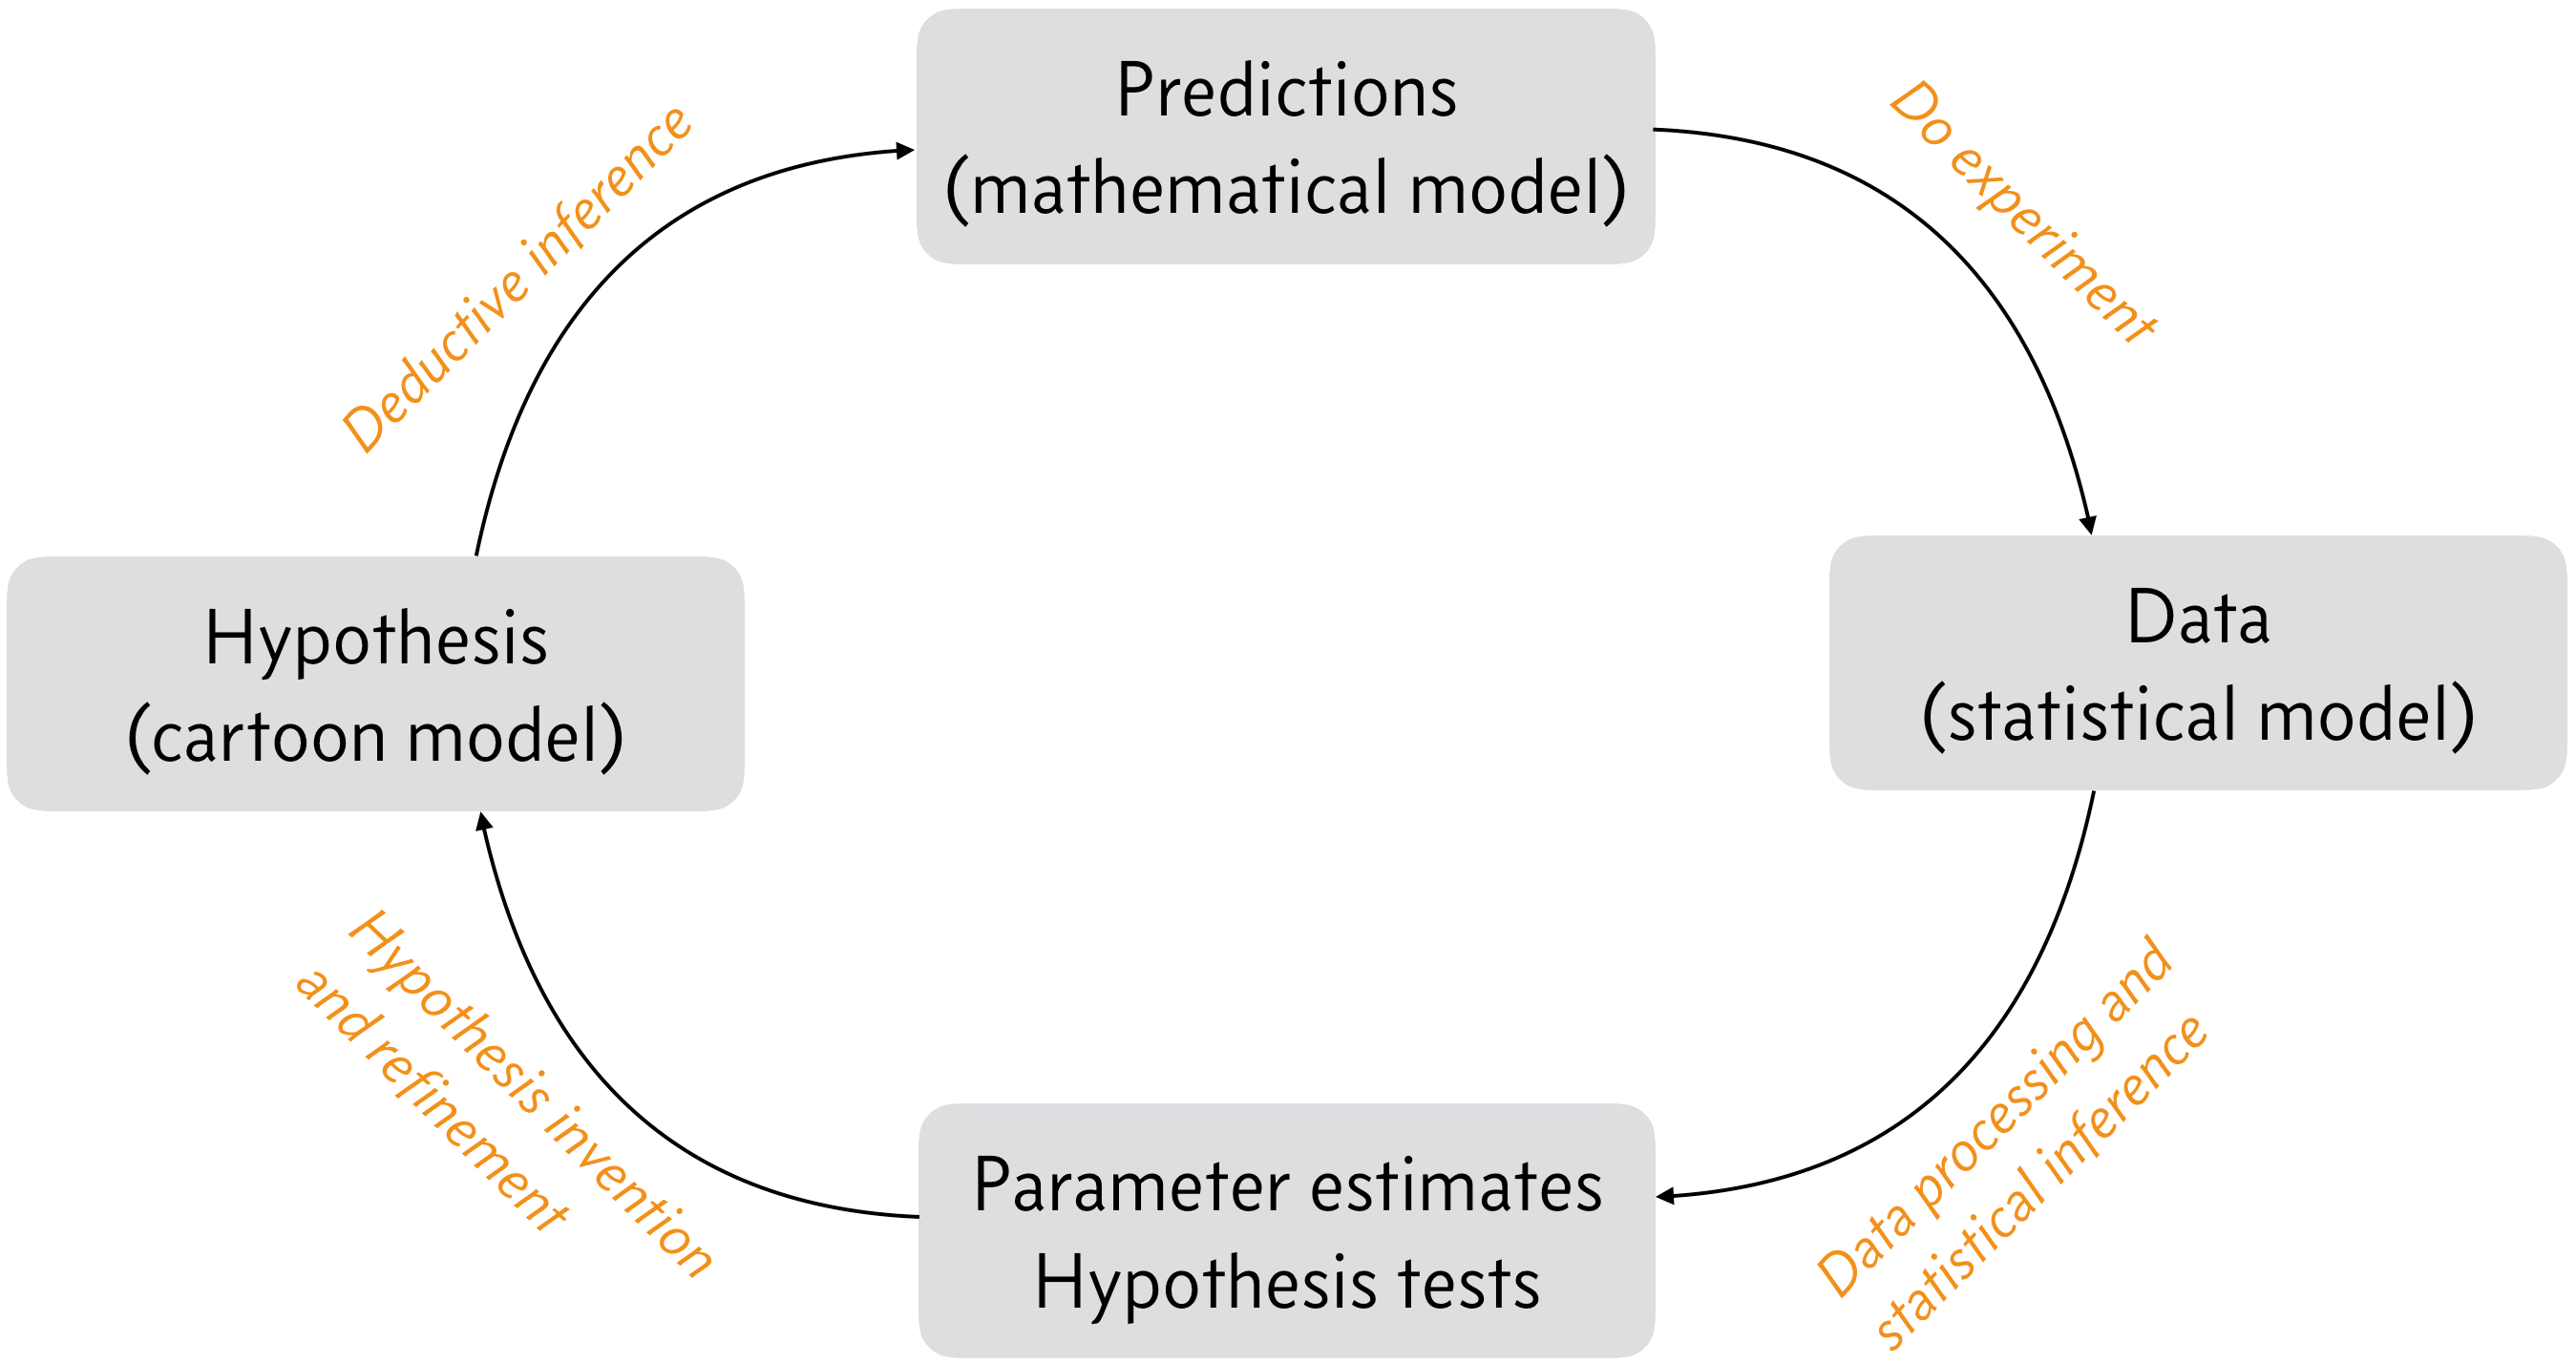
Being biologists who are doing data analysis, the word “model” is used to mean at least three different things in our work (neglecting “model organism,” “model in vitro system,” etc.). So, for the purposes of this course, we need to clearly define what we are talking about when we use the word “model.”
Cartoon model.
These models are the typical cartoons we see in text books or in discussion sections of biological papers. They are a sketch of what we think might be happening in a system of interest, but they do not provide quantifiable predictions.
Mathematical model.
These models give quantifiable predictions that must be true if the hypothesis (which is sketched as a cartoon model) is true. In many cases, getting to predictions from a hypothesis is easy. For example, if I hypothesize that protein A binds protein B, a quantifiable prediction would be that they are colocalized when I image them. However, sometimes harder work and deeper thought is needed to generate quantitative predictions. This often requires “mathematizing” the cartoon. This is how a mathematical model is derived from a cartoon model. Oftentimes when biological physicists refer to a “model,” they are talking about what we are calling a mathematical model. In the bacterial growth example, the mathematical model is that they grow exponentially.
Statistical model.
A statistical model goes a step beyond the mathematical model and uses a probability distribution to describe any measurement error, or stochastic noise in the system being measured. If \(y\) is the data set and \(\theta\) is a set of parameters involved in generating the data, this essentially means specifying \(f(y; \theta)\) (and \(g(\theta)\) in the Bayesian case, which we will get to next term). The statistical models we will use are generative in that the encompass the cartoon and mathematical models and any noise to use probability to describe how the data are generated.