Homework 3.1: The RNA Pol-II CTD and transcriptional bursting (80 pts)
Data set 1 download, Data set 2 download
The largest subunit of RNA polymerase II (Pol II) has a disordered domain on its C-terminus, the so-called C-terminal domain, or CTD. The CTD consists of repeats of seven amino acids. The number of repeats ranges from five to sixty in various species. Each heptad is referred to as a CTD repeat, or CTDr.
To investigate the effects of the number of CTDrs on transcriptional activity, Porfirio Quintero-Cadena and Paul Sternberg at Caltech, in collaboration with Tineke Lenstra at the Netherlands Cancer Institute, did a clever experiment (Molec. Cell., 2020). Pol II in wild type budding yeast Saccharomyces cerevisiae contains twenty-six CTDrs. Quintero-Cadena generated S. cerevisiae strains with varying number of CTDrs, starting as low as eight (the minimum number necessary for transcription). They also inserted several copies of a sequence that forms RNA hairpins upon transcription in the 5′ untranslated region (UTR) of the Gal10 gene. They also engineered the cells to have nuclear-expressed PP7, which binds RNA hairpins. The PP7 is fused with GFP, so when the gene of interest is being transcribed, a fluorescent dot will appear in the nucleus of the cell. A brighter dot corresponds to more active transcription. A schematic of the setup is shown below, taken from the paper.
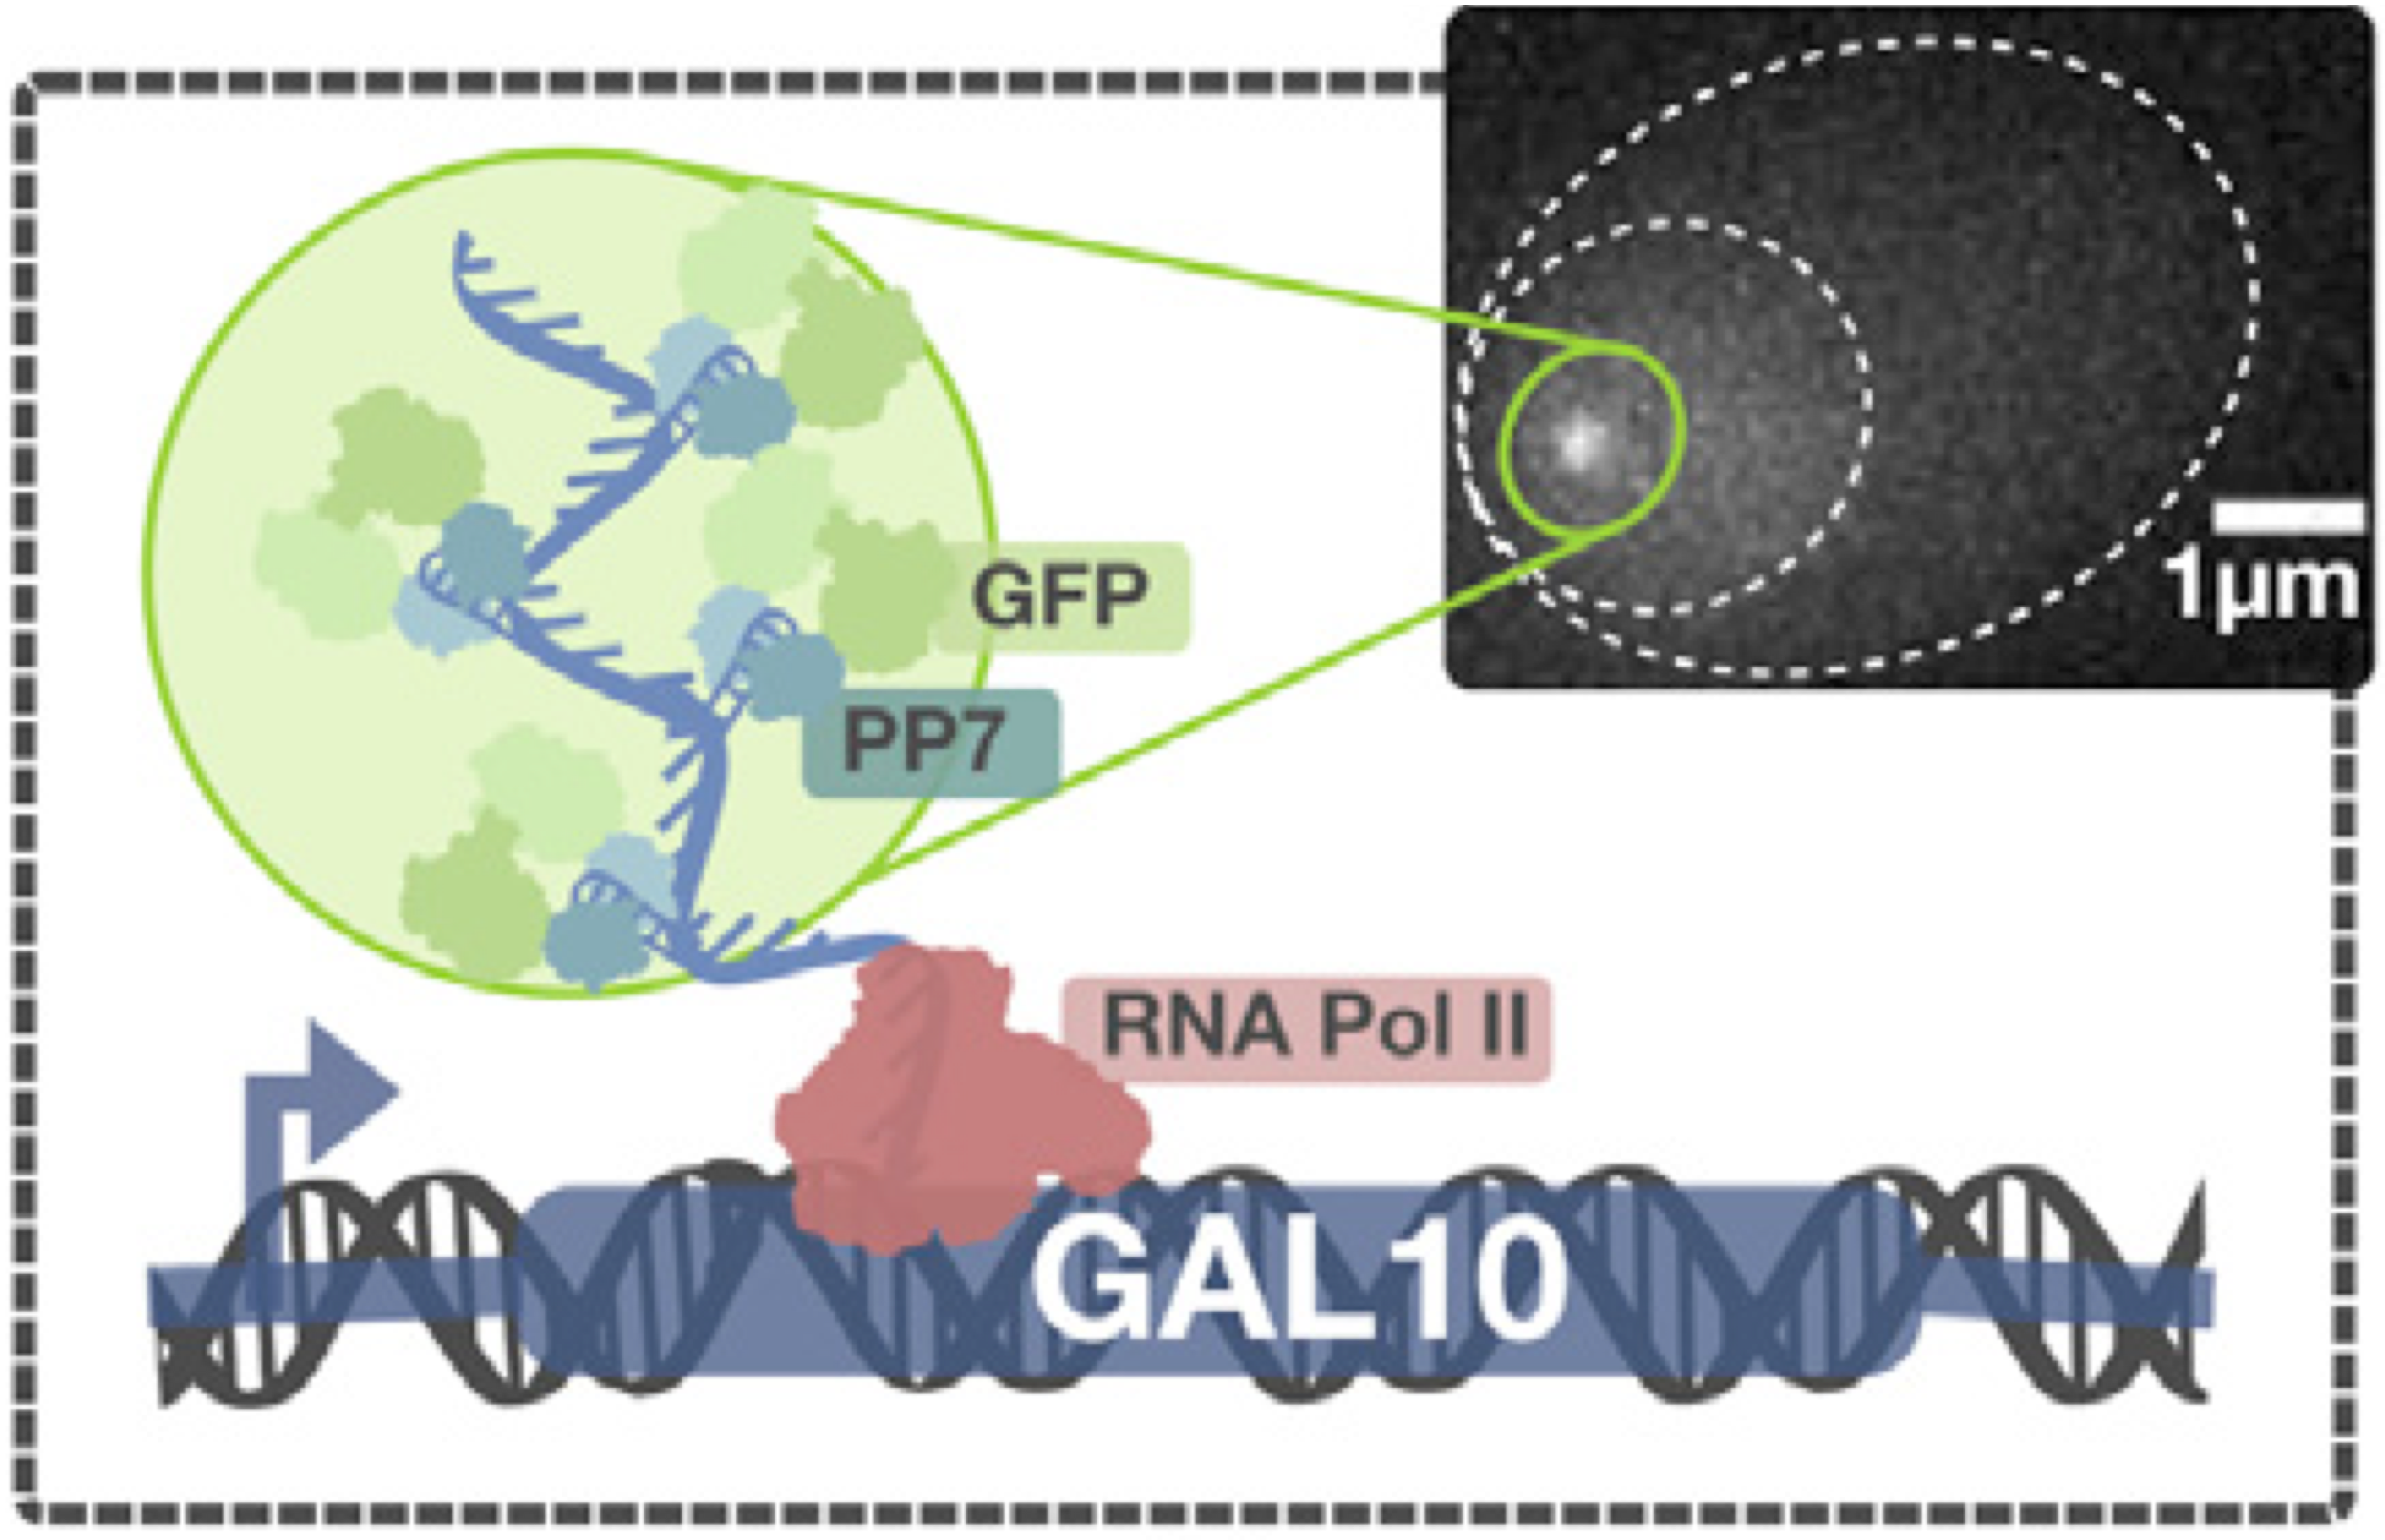
Conveniently, expression of Gal10 is induced by presence of galactose, enabling the experimenter to control when gene expression is turned on.
a) In one experiment, Quintero-Cadena induced transcription using galactose and then took snapshots of the cells with a fluorescence microscope. He used digital image processing techniques to locate, characterize, and quantify dots. The results of the image acquisition and analysis may be found here: https://s3.amazonaws.com/bebi103.caltech.edu/data/pp7_snapshot_parts.csv. The data are tidy, and when you load the data frame, each row refers to a single dot in the image. Below is a brief description of the columns. (Many of the columns refer to parameters of the image acquisition and processing using trackpy.)
column |
content |
|---|---|
date |
date of the experiment |
ecc |
eccentricity of the dot |
ep |
estimate of uncertainty in dot position |
frame |
which frame of the movie |
laser power |
Laser power for image acquisition |
mass |
integrated fluorescent intensity of dot |
mass_norm |
fluorescent intensity of dot normalized against nuclear fluorescent intensity |
mov_name |
name of movie snapshot was taken from |
nuc_fluor |
fluorescence throughout the nucleus containing the dot |
particle |
identifier of particle |
pid |
tag for image processing ID |
raw_mass |
total integrated intensity of the ROI |
roi |
index of region of interest containing the dot |
signal |
measure of how bright the dot is in bandpass-filtered image |
size |
radius of gyration of dot in image |
strain |
yeast strain |
traj_len |
length of the trajectory tracing the dot |
x |
x-position of center of dot in image |
y |
y-position of center of dot in image |
corrwideal |
correlation with ideal dot using a Gaussian process classifier |
time_postinduction |
number of minutes after galactose induction |
CTDr |
number of CTDrs in the strain |
The columns of most interest to you are mass_norm, time_postinduction, and CTDr. The corrwideal is also important, since we do not want to consider spurious artifacts in the image. Quintero-Cadena only considered dots that had a correlation above 0.5 in his analysis.
From this snapshot data set, make an informative plot or plots exploring how the fluorescent intensity varies with the number of CTD repeats. Be sure to comment on your findings.
b) Quintero-Cadena took another perspective on these data. He took snapshots and determined how many cells in the field of view were actively transcribing the target gene. A cell was deemed to be active if it has a transcription site whose integrated normalized fluorescence (mass_norm) exceeded a threshold. Quintero-Cadena used a threshold of 7.
You can download the data set with this analysis here: https://s3.amazonaws.com/bebi103.caltech.edu/data/pp7_frac_active_cells.csv
Column |
content |
|---|---|
time_postinduction |
number of minutes after galactose induction |
mov_name |
name of movie snapshot was taken from |
strain |
yeast strain |
no_TS |
total number of transcription sites in the image |
no_cells |
number of cells in the image |
frac_active |
fraction of cells deemed active |
thresh |
minimum number of dots required for a cell to be deemed active |
rep |
replicate of the experiment |
date |
date of the experiment |
CTDr |
number of CTDrs in the strain |
Use these data to make an informative plot or plots exploring the effect of the number of CTDrs and the time after induction on the activity of cells.
Porfirio Quintero-Cadena is a former student and TA of this course. He is also a believer in open access to (tidy) data. The data sets used in the paper are freely available and CC-0 licensed, which means we may use them completely freely. If you want people to learn more from your hard-earned data, follow Porfirio’s example andmake them freely available.